

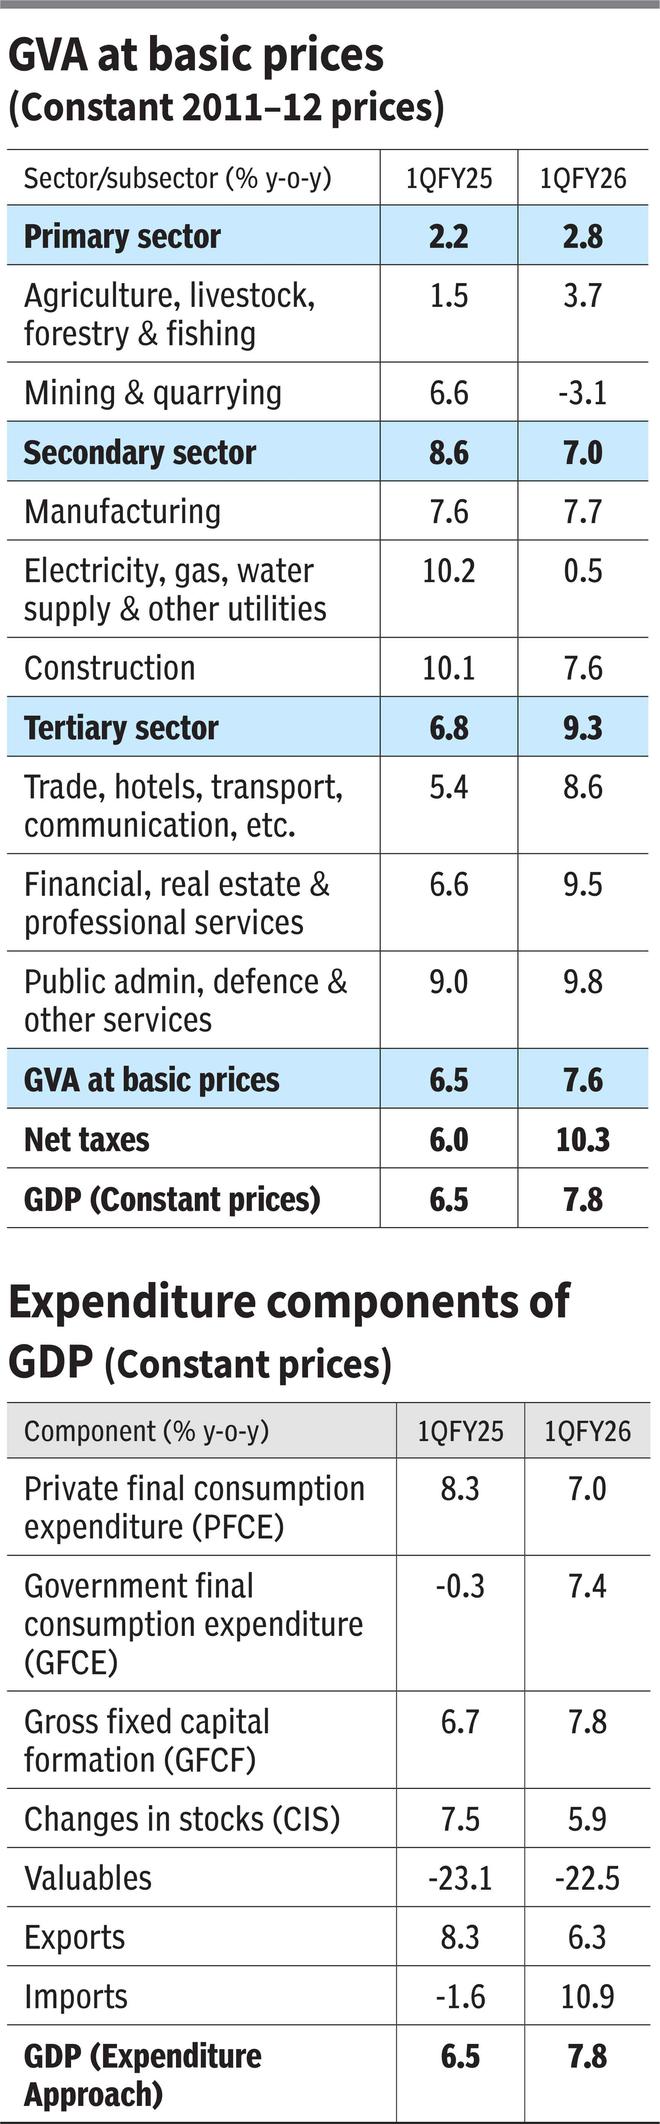
India’s Q1 FY26 GDP print suggests a robust economic expansion, with real expenditure GDP growing by 7.8 per cent year-on-year — well above consensus estimates (6.7 per cent) and the Reserve Bank of India’s projection (6.5 per cent). This marks an improvement from 6.5 per cent in Q1 FY25 and 7.4 per cent in Q4 FY25. Real Gross Value Added (GVA) rose by 7.6 per cent, up from 6.5 per cent, while nominal GDP growth decelerated to 8.8 per cent from 9.7 per cent a year ago. Sectorally, agriculture rebounded to 3.7 per cent growth (from 1.5 per cent), despite mining disruptions. Manufacturing and construction posted solid gains of 7.7 per cent and 7.6 per cent, respectively. Services led the charge with over 9 per cent GVA growth.
On the demand side, private final consumption expenditure (PFCE) moderated to 7 per cent from 8.3 per cent, while gross fixed capital formation (GFCF) accelerated to 7.8 per cent from 6.7 per cent. Government consumption surged nearly 10 per cent, contributing significantly to headline growth.
Yet beneath the surface, the data reveals a troubling disconnect between macro aggregates and microeconomic realities. Industrial output remains subdued, urban consumption is tepid, and private investment lacks momentum. Rural demand shows modest revival, but it’s largely offset by weak corporate performance, banking trends, and fiscal stress.
This divergence raises critical questions: if GDP growth has been consistently overshooting expectations in Q4 FY25 and Q1 FY26, why did policymakers front-load a 50 basis point rate cut, announce employment incentives, and reduce GST rates? Moreover, the GDP print implies immunity to rising US tariffs — an assertion at odds with growing diplomatic and trade anxieties at the central government level.
Nominal indicators paint a more sobering picture even compared to the deceleration in nominal GDP. Non-finance company sales grew just 3.8 per cent in Q1 FY26 (NSE 500 index excluding financials). Incremental credit lending halved compared to last year, and direct tax collections contracted. Private bank interest income decelerated sharply to 5.9 per cent.
Widespread deceleration
High-frequency data released alongside GDP figures — mostly real variables — reinforce this slowdown. Of the 22 indicators tracked, 18 decelerated. Only four accelerated: cement production (due to a low base), cargo at major ports, central government revenue expenditure (excluding interest and subsidies), and the capital goods index. Despite pre-emptive trade activity ahead of tariff hikes, both exports and imports of goods and services slowed. Key declines included coal production (-0.3 per cent), crude output (-1.9 per cent), private vehicle sales (-5.4 per cent), mining IIP (-3 per cent), and electricity IIP (-1.5 per cent). Overall IIP growth averaged just 2 per cent, with 11 indicators growing below 4 per cent. These are considerably at odds with manufacturing GVA growth reported at manufacturing sector growth of 7.7 per cent.
This widespread deceleration contradicts the headline GDP acceleration. Much of the growth appears statistically skewed, driven by a 26 per cent surge in government spending — reflecting a low base from last year’s 70 per cent contraction. Even with a substantial ₹2.7 trillion RBI dividend, the fiscal deficit widened, underscoring risks from falling income and corporate tax revenues. The recent GST rate cut, estimated by analysts to cost ₹700-800 billion, further strains both Central and State finances.
A particularly glaring disconnect lies in consumption data. The GDP report shows 7 per cent real consumption growth, down from 8.3 per cent last year. Yet consumer company performance — both staples and discretionary — and RBI’s household surveys suggest otherwise. Given that private consumption accounts for 60 per cent of GDP, this mismatch is critical. IIP data shows consumer goods production grew just 0.2 per cent YoY, down from 2.9 per cent. Incremental personal credit lending also contracted, except for loans against deposits and gold — suggesting household stress.
Private capex
The GDP report does not disaggregate capital formation between public and private sectors. However, nominal GFCF grew 8.3 per cent, while government capital outlay (excluding loans) surged 52 per cent. This implies private capex either contracted or remained flat, likely declining in real terms.
This isn’t a new phenomenon. The disconnect between headline GDP and ground realities has persisted since demonetisation, exacerbated by GST implementation, the NBFC crisis, Trump-era tariffs, and Covid-19 shocks. Supply-side reforms have failed to catalyse private investment or job creation, leading to rising public debt, servicing costs, flat real wages and rising tax incidence on households.
These distortions stem partly from outdated GDP methodology (see ‘GDP Base Revision: Time to Regain Confidence’, CPR June 2025). The current 2011-12 base year relies heavily on the MCA-21 database and questionable assumptions. Company-level NIC codes often misrepresent actual business activities. The 74th NSS round found 12 per cent of units untraceable and 20 per cent misclassified, undermining organised sector data. Moreover, organised sector growth is extrapolated to estimate unorganised sector performance — particularly in trade, hotels, and education— potentially inflating GDP figures.
Deflator volatility, especially in transport and public administration, further complicates real versus nominal comparisons. Sharp revisions in manufacturing and trade between the 2004-05 and 2011-12 series highlight inconsistencies in data sources and estimation techniques.
Capturing the unorganised sector — nearly 44 per cent of GVA — is even more problematic. Growth estimates rely on outdated surveys or proxies like GST ratios, which may not reflect informal dynamics. Construction is estimated using a fixed input-output methodology from 1981, ignoring evolving patterns and informal labour. NSS and PLFS data show stagnant or declining real earnings for self-employed workers, contradicting headline growth. Agricultural output also appears inflated, with a 92-million-tonne cereal surplus unexplained by consumption data.
Economic shocks have disproportionately hit the informal economy, yet official statistics fail to capture this divergence. The transition from ASI to MCA-21 has introduced classification errors, scaling biases, and a lack of State-level granularity — raising fundamental questions about the robustness of India’s national accounts.
Growing scepticism
Financial markets are already reflecting this scepticism. The rupee/dollar rate hit an all-time low of 88.20, and 10-year G-sec yields hardened by 40 basis points to 6.60 per cent — contrary to expectations following the recent S&P sovereign rating upgrade. Equity markets have remained flat over the past year, underperforming bonds and witnessing a ₹30 trillion erosion in market capitalisation — roughly 15 per cent of household income. Sectoral performance has been uneven, with private banks and NBFCs outperforming, while media, real estate, IT, PSUs, oil and gas, FMCG, and capital goods posted deep negative returns. Mid and small caps declined by 5-6 per cent, reflecting broader investor caution.
If this economic fragility becomes entrenched in market perception, household net worth erosion could intensify. The growing disconnect between GDP data and lived realities — across households, corporates, banks, and governments — raises doubts about the relevance of these figures for policymaking, corporate strategy, and household decisions.
To restore credibility, India must adopt transparent methodologies, robust surveys, and simultaneous index updates. State-level data quality needs urgent improvement, along with disaggregation of capital spending between private and public sectors. Quarterly estimates of household income and savings based on survey data would foster greater trust and alignment with economic realities.
The writer is CEO and Co-Head of Equities & Head of Research, Systematix Group. Views are personal
Published on September 1, 2025
RELATED POSTS
View all

Women-led farming cooperatives: Empowering communities through agriculture
March 8, 2025 | by ltcinsuranceshopper


US, Russia to meet in Saudi Arabia over Ukraine war
February 16, 2025 | by ltcinsuranceshopper