

Umnat Seebuaphan
Dear Partner,
Throughout 2024, we replaced slower-growth firms with durable, faster-growing firms in temporarily depressed sectors and identified similar opportunities in new industries. These firms align with our longer-term growth themes of consolidation, forced selling of assets, transaction processing, affordable housing finance, distribution, infrastructure spending and housing construction. We identified and continue to analyze opportunities in the following industries: specialized construction, natural resource royalties, distributors, logistics companies, housing, and specialty finance. New investments have a combined expected growth rate (return on equity (RoE) * (1-payout ratio)) plus earnings yield of at least 30 to 40%, a metric of deep value incorporating growth.
As we continue to add faster-growing durable companies to the portfolio, I believe we have the highest- quality businesses in the fund’s history, with a discount that continues to persist as the market fails to realize the improvement in our firm’s positions. I believe high quality is reflected in free cash flow growth with highly recurring revenues (such as in subscription businesses), high free cash flow conversion, and returns on equity that are higher than less-risky alternatives, such as well-underwritten debt which currently has yields in the low-teens.
The Bonhoeffer Fund returned a loss of 9.7% net of fees in the fourth quarter of 2024. In the same time period, the MSCI World ex-US, a broad-based index, returned a loss of 7.7%, and the DFA International Small Cap Value Fund (DISV), our closest benchmark, returned a loss of 6.5%. As of December 31, 2024, our securities have a weighted average earnings/free cash flow yield of 13.7% and an average EV/EBITDA of 3.4 with 13% growth.
The current Bonhoeffer portfolio has projected earnings/free cash flow growth of about 13.7%. The DFA International Small Cap Value Fund had an average earnings yield of 11.4% with 7.9% growth. Bonhoeffer Fund’s and the indexes’ multiples are lower than the previous quarter, primarily due to share price declines.
Bonhoeffer Fund Portfolio Overview
Bonhoeffer’s investment portfolio consists of deep value-oriented special situations, as well as growth- oriented firms that can compound value over time and have been purchased at a reasonable price. In most cases, we are paying no more than mid-single digit multiples of five years forward earning per share. We are particularly interested in companies in market niches that grow organically and/or through transition or consolidation. We also like to see active capital allocation through opportunistic buybacks, organic growth and synergistic acquisitions. And importantly, we like to see durability, as measured by increasing recurring revenues, high free cash flow conversion and consistent and growing RoEs in our portfolio companies. There were modest changes within the portfolio in the fourth quarter, which are in line with our low historical turnover rates. We sold some of our slower-growing investments that are not buying back their stock and invested some of our cash into niche growing banks, like FFB Bancorp (OTCQX:FFBB), Northeast Bancorp (NECB), Citizens Bank, Mission Bank (OTCPK:MSBC) and United Bancorp of Alabama (OTCQX:UBAB), described in the case study below. We also invested in a new infrastructure holding: Mattr Corp. (OTCPK:MTTRF)
As of December 31, 2024, our largest country exposures included: United States, United Kingdom, South Korea, Canada, Latin America, and Philippines. The largest industry exposures included: distribution, real estate/infrastructure/finance, telecom/media, and consumer products.
Conclusion
As always, if you would like to discuss any of the investment frameworks or specific investments in deeper detail, then please do not hesitate to reach out. I want to thank you for the opportunity to invest by your side and welcome any questions you may have.
Warm Regards,
Keith D. Smith, CFA
INVESTMENT THEMES
Compound Mispricings (9% of Portfolio; Quarterly Performance -20.1%)
Our Korean preferred stocks, Asian real estate and Vistry (OTCPK:BVHMF) all feature characteristics of compound mispricings. The thesis for the closing of the voting, nonvoting, holding company and multiple business valuation gap includes evidence of better governance and liquidity and the decline or sale of the legacy business. We are also looking for corporate actions such as spinoffs, sales, share buybacks, or holding company transactions and overall cash flow growth.
Our Vistry holding is a compound mispricing as it is exiting its private homebuilding business to focus exclusively on its partnership business. The private homebuilding business focused on buying land, building then selling homes. The partnership business is an arrangement where local governments and housing authorities provide the land/buildings and Vistry upgrades and builds new housing. Vistry generates revenue from these partnership and from the fees associated with the construction of new homes and improvements on existing homes and selling a portion of the refurbished homes into the open market. The largest benefit of the partnership model is that it allows the business to be capital light and the demand is not as cyclical as the private homebuilding market. The largest drawback is the customers are local governments or non-profit agencies whose objectives include non-economic ones and can result in delays and lower profit margins than traditional homebuilding. Over the past 10 years, two UK firms (Gillford Try and Countryside) have disclosed pre-tax returns on their partnership business which have averaged in the low 40% range. These returns have declined over the past few years as the UK homebuilding sector has experienced declines in demand and public funding.
NVR in the United States also has a capital light home building model. Some analysts compare Vistry to NVR but there are significant differences between NVR and Vistry. The table below outlines the major differences between NVR and Vistry:
|
Characteristics |
Vistry |
NVR |
|
Market Segment |
Affordable |
Entry-level Free-Market |
|
Incentives |
Non-economic & Economic |
Economic (Free Market) |
|
Permitting |
Complex process w many players |
Less complex w fewer players |
|
Customer Financial Strength |
Financial strain of local governments and agencies |
Government support of homebuyer and less urban locations |
|
Geographic Clustering |
Geographically diverse |
Clustered in Mid Atlantic |
|
Capital Allocation |
Dividends/Buybacks |
Buybacks |
|
Forward Guidance |
Provides – Reactive |
Doesn’t Provide |
|
Building Methods |
Modern Manufacturing |
Modern Manufacturing |
|
Capital Intensive |
Land/property light provided by customers |
Land light via options |
Although Vistry and NVR have many similarities such as being capital light, utilizing modern manufacturing and efficient manufacturing/homebuilding, there are significant differences which will lead to lower returns on capital and less certain revenue generation than NVR. Management expects Vistry’s return on capital in the future to approach 40% pre-tax (30% after-tax) based upon historical partnership returns described above. As a result of Vistry’s exit from the private homebuilding business, excess land will be sold to fund £500 million of share (25% of the current market capitalization) repurchases. The current level of share buybacks is 4% per year before the sale of the excess land.
In Q4 of 2024, Vistry’s shares have declined by about 60% due to three profit warnings. These warnings are the result of cost overruns in private homebuilding (a business Vistry is exiting), deferral of partnership project decisions and deferral of revenue receipt due to building delays. These delays and cost overruns have shaken confidence in Vistry’s longer-term returns. The current run rate of home delivery is 17,200 per year with 73% from partnerships (12,400 homes) and 27% from private homebuilding (4,800 homes). The current pipeline of homes is 16,500 units. Vistry plans to replace the private homebuilding homes with partnership homes over the next few years.
The range of future values for Vistry is dependent upon how well the private/partnership transition goes and how much partnership growth Vistry can achieve. Another key metric is the steady state profit margins. Vistry’s historical margins have declined from mid to upper teens (5-10 years ago) to high single digits over the past 5 years declining to about 5% in 2024. Some analysts assume the current low profit margins will continue with flat overall unit volume over the next few years and a 9x multiple results in a value around the current price (£6 per share). Management’s expectation is for 30% after-tax return on capital modest revenue growth of 5-8% per year and profitability in the low teens. Given these assumptions and a 11-17x multiple range yields a value range of £20-30 per share. Our view is management’s expectations will be realized over a time frame later than originally expected, therefore, £20-30 per share value will be realized over the next five years.
Public Leverage Buyouts (LBOs) (39% of Portfolio; Quarterly Performance -10.3%)
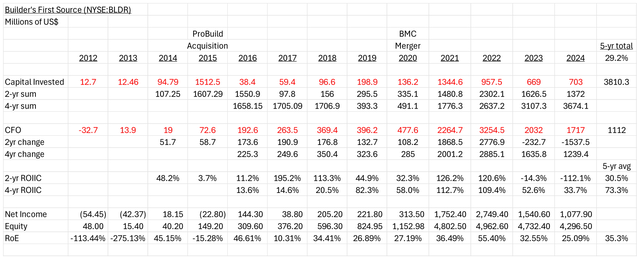
Our broadcast TV franchises, leasing, building products distributors and dealerships and service outsourcing, fall into this category. One trend we find particularly compelling in these firms is growth creation through acquisitions, which provides synergies and operational leverage associated with vertical and horizontal consolidation. The increased cash flow from acquisitions and subsequent synergies are used to repay the debt and repurchase stock, and the process is repeated. This strategy’s effectiveness is dependent upon a spread between borrowing, interest rates and the cash returns from the core business and acquisitions. Over the past few months, long-term interest rates have been declining and short-term rates are expected to follow so a large and growing spread is available to firms, like Builders First Source (BFS) who have a high return on capital. One way to measure future expected returns are post-synergy cash flow ratios paid for acquisitions. Another way to measure future growth in expected returns is through incremental return on incremental invested capital (RoIIC).
Many of our holdings used the acquisition/buyback model described above. Some of these firms have also used modest leverage to magnify the returns of equity to 20% and above, over the past five to ten years from the acquisition/buyback model. These firms include: Terravest (OTCPK:TRRVF), Asbury Automobile (ABG), Ashtead (OTCPK:ASHTF), Autohellas (OTCPK:AOHLF), Builders First Source and NOA. In addition, many of these firms are buying back stock and the modest current valuations make these buybacks accretive BFS is an example of an interesting public leveraged buyout (“LBO”). BFS is a consolidator of building products distributors and select building products, namely trusses, millwork and pre-assembled housing components. BFS utilizes its distribution relationships to sell its building products. BFS’ business are local businesses which have local economies of scale that BFS’ can utilize to generate above average returns on capital. Since BFS is largest building products distributor in the US, they have the largest scale advantages illustrated by having the highest margins and inventory turns amongst their competitors. BFS uses its software to design structures and facilitate distribution of building products. BFS is dependent upon single family home (“SFH”) construction and to a lesser extent multi-family home (“MFH”) construction. With both of these segments either slowing down (SFH) or halting new construction (‘MFH’), the near-term outlook is not too good. Higher interest rates have caused much of this slowdown. With the new administration following policy that should reduce interest rates, interest rate declines should be a tailwind going forward.
Recently, BFS had a management change as the CEO became the chairman and the CFO moved into the CEO role. The Chairman has retained his shares. Brad Jacobs, a successful CEO in businesses that implement automation, has taken an interest in building products distribution through his firm, QXO. QXO recently made an offer to purchase a building products distributor, Beacon Roofing (BECN). BFS has advanced the furthest in terms of truss automation compared to other truss manufacturers. BFS management has also stated that the M&A pipeline is strong.
A useful tool in evaluating returns on capital is return on incremental invested capital (“ROIIC”) analysis. One way to calculate RoIIC, is to divide the changes in cashflow from operations (‘CFO’) by the capital expenditure and merger and acquisition investment over a given period of time. Below is the calculation of the RoIIC over the past 10 years. As can be seen from the RoIIC analysis, BLDR’s RoE and RoIIC has increased over the past five to ten years. The BMC acquisition will further increase BLDR’s RoE. Below is the updated BLDR RoIIC analysis:
Below is an updated 5-yr Discounted Cash Flow (DCF)valuation for BLDR:
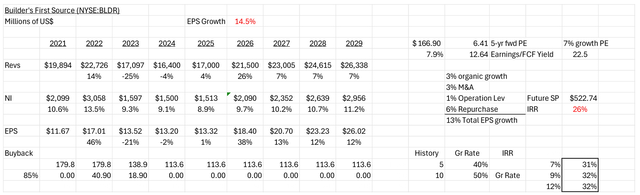
The key assumptions in this DCF include an increase in operating margin from operating leverage as revenues rebound with a housing recovery and about a 10% of market cap buyback. The 10% buyback represents 85% of projected income in-line with historical buybacks as percentage of net income. These assumptions result in a low twenties EPS growth rate over the next five years, a $647 per share value and a 31% IRR.
Distribution (52% of Portfolio; Quarterly Performance -13%)
Our holdings in car dealerships and branded capital equipment dealerships, building product distributors and electrical component distributors all fall into the distribution theme. One of the main key performance indicators for dealerships is velocity, or inventory turns. We own some of the highest velocity distributors in markets around the world.
A high growth distributor in the portfolio is Asbury Automotive. Asbury’s model is to grow earnings through merger and acquisition, or buy back shares if acquisition targets are not available for a reasonable price. Asbury buys platform dealerships in geographic markets that can be used to drive local synergistic acquisitions and increased sales and profits. The current level of FCF RoE is about 19% with incremental returns on invested capital of about 19%. Below is the updated RoIIC analysis for Asbury:
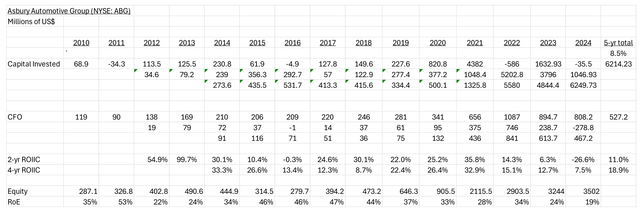
Given the cyclicality of Asbury’s earnings, it is better to look at the longer-term average RoIICs and averages. In this case, the 4-year RoIIC is 19%. Forward estimates of revenue and earnings to 2029 are illustrated in DCF analysis below. This results in a 5-year growth rate of 19% consistent with the past 10- year growth rate (20%) and lower than the 5-year growth rate (24%). Many of the past trends, such as consolidation and buybacks, are expected to continue over the next 5 to 10 years. Below is an updated 5- year DCF for Asbury:
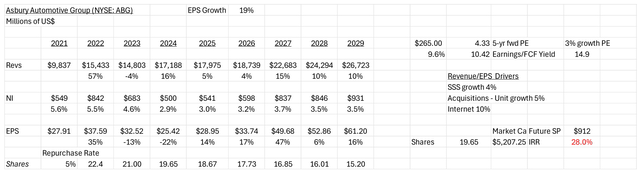
The revenue projections are consistent with Asbury’s revised revenue post-2030 revenue target of $30 billion. Projected share repurchases are about 50% of net income which is consistent with periods of modest acquisitions for Asbury in the past. With continued EPS growth from further acquisition and share repurchases, as shown above, the 2029 EPS will rise to $61 per share. With these growth rates, multiples should increase to 15x from the current multiple of about 10x. This results in a value range of $912/share and an IRR of 28%.
Telecom/Transaction Processing (10% of Portfolio; Quarterly Performance -8.9%)
The increasing use of transaction processing in the markets of our respective firms, as well as the rollout of fiberoptic and 5G networks, is providing growth opportunities within this theme. Given that most of these firms are holding companies and have multiple components of value (including real estate), the timeline for realization may be longer than for more mono-industry-focused firms.
Millicom (TIGO) is one the remaining telecom firms in the portfolio as the company retains favorable market conditions including operating in many two player markets or in markets where the number of participants is getting smaller. With fewer players, telco firms can recover pricing power to offset the increasing cost of network construction and operations. In one of its key markets, Columbia, a large player has entered bankruptcy which will reduce the number of market players. In addition, Millicom is in negotiations to buy the assets of this firm.
The sale of Millicom’s tower unit, Lati to SBA Communications (SBAC) has been completed. The stock price has not moved significantly since the tower sale. Millicom continues to implement cost cuts identified by the new CEO and team that was put in place by the new large shareholder, Xavier Niel. In addition, Millicom has announced a $3/yr dividend which is currently yielding over 11% at the current stock price. Based upon the recently released 4Q financials, Millicom is selling for a FCF yield of 15%. Earnings have grown by 10%/year over the past five years and are expected to grow by 15% over the next five years. Xavier has executed tender offers for Millicom shares (the latest of which was $25.75 per share), which has increased his stake in Millicom to 40%. Given Mr. Niel’s interest in purchasing 100% of TIGO, I feel the upside may be capped. However, based upon Millicom’s performance and dividend yield, the share price should appreciate to reflect the good performance and capital allocation.
Consumer Product (7.0% of Portfolio; Quarterly Performance -0.9%)
Our consumer product retailing, tire, and beverage firms comprise this category. The defensive nature of these firms can lead to better-than-average performance. One theme we have been examining is the development of category-killer retail franchises. These firms have developed local franchises which have higher inventory turnovers, margins, and sales per square foot than competitors. These factors resulted in great unit economics and high returns on incremental invested capital. They also have some unique characteristics, including specialty niches (such as tire stores or athletic shoes) or offering something the competitors will not do (such as selling hunting supplies).
One of our consumer products firms is Academy Sports and Outdoors (ASO). ASO is the second largest sporting goods store in the US and has industry leading sales/sq.ft., sales/store and EBITDA/store. ASO has positioned itself as a price leader that also offers a wide selection of merchandise. ASO’s strategy is to roll out new stores (160-180 stores over the next five years) in existing and adjacent markets in the Midwest that can be serviced by its existing logistic infrastructure. This will increase ASO’s footprint by about 50%. These stores have and are expected to generate a return on capital of greater than 20%. The company has a long-term plan of achieving $10 billion in revenue and $1 billion in net income. To achieve these goals, the company plans on spending 50% of cash flow on capital expenditure leaving the remaining cash flow available for share repurchases. The return on incremental investment analysis is shown below:
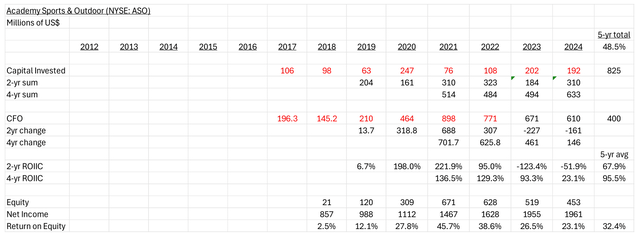
Given the cyclicality of ASO’s earnings, it is better to look at the longer-term average RoIICs. In this case, the 4-year RoIIC is 96%. Forward estimates of revenue and earnings to 2029 is illustrated in DCF analysis below. This results in a 5-year EPS growth rate of 26% lower than the 5-year growth rate of 43%. Many of the trends driving the historical EPS growth including store roll-outs and share repurchases, are expected to continue over the next five to ten years.
Below is an updated 5-year DCF for ASO:
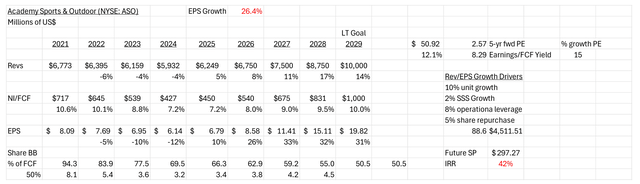
This DCF is consistent with ASO management’s goal of $10 billion in sales and
$1 billion in net income over the next five years. This revenue growth is also consistent with management’s plan for expansion of the store footprint by 50% over the next five years. With continued EPS growth from operational leverage and share repurchases, as shown above, the 2029 EPS will rise to $20 per share. With these growth rates, multiples should increase to 15x from the current multiple of about 10x. This results in a value of $300/share and an IRR of 42%.
Real Estate/Construction/Finance (50% of Portfolio; Quarterly Performance -8.1%)
The current construction holdings (in US and Europe through Builders First Source and Vistry, respectively) should do well as governments worldwide incentivize infrastructure programs, and new construction continues to replenish the housing deficit in the US and the UK. Financing of low-income real estate development as well as growth in small business lending (via small business administration (“SBA”)) and the purchasing of forced sale loans from mergers and acquisition as well as the FDIC are themes driving growth in our bank holdings, FFB Bancorp (“FFB”), United Bancorp of Alabama (“UBAB”) and Northeast Bank (“NB”). We are looking for banks with sustainable RoEs and EPS growth rates higher than about 20% that are selling for single digit multiples and have decent underwriting. We continue to find banks that meet these criteria. An example is UBAB, whose investment thesis is laid out in this quarter’s case study.
FFB continued to grow in 2024 with an EPS of $10.72 and a 14% revenue growth rate over the past year. FFB received a consent order in January associated with its higher risk third-party ISO transaction processing customers. The consent order allows FFB to repurchase common stock and allow continued on-boarding low and moderate risk transaction processing customers. The estimated financial impact of the consent order is about $10 million (or $3-$4 per share) based upon the loss of processing fees and low-cost deposits over the next 12 months and additional compliance costs. Earlier in 2024, FFB hired a former 8-year FDIC lawyer as head of compliance. If FFB can replace the high-risk customer revenue with low or moderate rick customers or other service fees, the financial impact will be more of a one-time event versus a recurring one. The recent compliance hire should facilitate the timely resolution of the consent order. FFB stock price declined from $95 to $83 per share as a result of this order. If the consent order turns out to be a one-time event, then the current price is less than eight times current earnings.
NEW PORTFOLIO IDEAS BANKS
We have continued to examine and evaluate niche banking services overseas. One niche that is interesting is multi-family lending. In the US, there are two segments of the multi-family lending niche, the Government Sponsored Entity (“GSE”) segment, where loans are originated and securitized with a government guarantee and the hold on the balance sheet segment where the loans that are held on the bank’s balance sheet. Merchants Bank of Indiana (“MBIN”) services the GSE segment while Malaga Bank (OTCPK:MLGF) services the held-on balance sheet segment. Malaga Bank is geographically focused in the South Bay region of Southern California. Multi-family lending typically has low losses if LTVs are below the GSE level of 75% and the lenders have a personal guarantee from landlords. As an example, Malaga Bank has no defaults or criticized loans and generates low teens RoEs, 1.5% RoAs with modest equity/assets of 12.7% and an efficiency ratio of 29%. Malaga Bank currently trades for ten times earnings.
In the UK, the multi-family niche, called buy-to-lease (“BTL”), is serviced by OSB Group (“OSB”) and Paragon Banking Group (“PBG”). Both of these firms have similar characteristics as the US firms (low defaults, modest LTVs and have landlord personal guarantees) but have more leverage (illustrated by lower equity/asset ratios). OSB generates 18% RoEs with a 32% efficiency ratio, 1.3% RoA, and equity/assets of 7.1%. OSB has historic loan losses of 0.4% of loans. OSB sells for five times earnings. PBG generated low teens RoEs, 1.0% RoAs and has an equity/assets of 7.3%. PBG has historic loan losses of 0.15% of loans. PBG sells for nine times earnings.
INVESTING IN COMMODITIES VIA ROYALTY FIRMS
We have been investigating royalty firms recently. These firms provide investors with a lower risk way to invest in commodities such as oil and gas, gold, silver, coal and copper. Many of these firms are in terminal decline as they invest in declining assets. The perpetual asset royalty firms are of interest as they generate a cash flow stream into perpetuity. These firms typically continue to purchase royalty interests to offset the natural decline in cash flows associated with commodity single location royalty streams.
One way to evaluate these firms is to add together volume changes/share and their dividend yield. This metric provides the underlying growth of the cash flow stream independent of commodity prices. This underlying growth allows these firms to increase cash flows in excess of commodity price changes. Recently, some of these perpetual royalty firms have generated underlying growth rates of 15% to 20% per year. An example is Dorchester Mineral, LP, (DMLP) which generates an 11% yield with 4% production growth per share growth over the past 15 years. Another example is Viper Energy, Inc. (VNOM), which generates a 5.6% yield with a 10.7% production growth per share over the past five years.
CASE STUDY – UNITED BANCORPORATION OF ALABAMA (OTCQX:UBAB)
United Bancorporation of Alabama (“UBAB”) is a community bank located in Alabama that provides banking service to small and mid-sized businesses (“SMEs”) in Alabama and Northwestern Florida, as well as low-income housing and municipal loans across the Southeast. UBAB services one of the fastest growing regions of Alabama and Florida (the Panhandle Beach Cities). UBAB also originates and services low-income loans which provides a large amount of non-interest income from fees, grant and tax credits (which can be sold to third parties). UBAB operates out of its headquarters in Atmore, AL, and nineteen locations across Alabama and Florida. UBAB services Baldwin, Escambia, Monroe, Mobile, Jefferson and Wilco counties in Alabama, and Santa Rosa county in Florida. UBAB is a designated community development finance institution (“CDFI”) thus is eligible for US Treasury incentive payments. UBAB also has a subsidiary, UB Community Development, LLC (“UBCD”), that manages allocations of New Market Tax Credits (“NMTC”) to UBAB financed entities. UBAB’s strategy includes financing low-income community development entities. In addition, UBAB also has two subsidiaries who are NMTC equity investment funds.
UBCD provides funding solutions designed to increase economic development, build affordable housing, create jobs and promote better access to goods and services. UBCD’s New Markets Tax Credit, Community Housing Capital, and Community Facilities Lending Programs are being used to help finance projects related to education, affordable housing, healthcare, manufacturing, public works and more. UBCD has over 40 projects that have been financed over the past 10 years.
UBCD receives funds from the US Treasury for low income and community development financing activities. UBCD also has received funds from the NMTC program, the Financial Assistance (“FA”) program, the Equitable Recovery Program (“ERP”), the Capital Magnet Fund (“CMF”). The CDFI small dollar award program and the bank enterprise award (“BEA”) program. In addition, UBAB participates in Community Housing Capital commitments ($20 million in 2022) and Community Facilities Lending funding ($15 million in 2022).
In 2022, $45 million of 2021 NMTC dollars were allocated to UBCD and UBCD received $995,000 from the SDLP, FA and BEA programs. In 2023, $65 million of 2022 NMTC dollars were allocated to UBCD and UBCD received $15.1 million from the FA, ERP, BEA and CMF programs. For 2024 year to date, UCBD received $10.3 million from the FA, BEA and CMF programs. In addition to its own NMTC allocation, UBAB has partnered with the NMTC recipients for an additional $52.5 million of NMTC in 2022 as well as $8.3 million in State of Mississippi NTMCs.
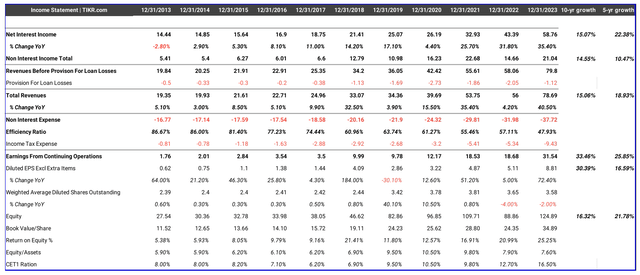
UBAB has grown EPS by almost 17% per year over the past five years and 22% over the past ten years. This growth is driven by providing low-income loans, selling tax credits and providing commercial and commercial real estate loans. UBAB’s lending franchise and loan purchase generates an average loan yield of 6.7% and has organically grown loans by 15% per year over the past five years. The strong loan growth is comprised of criticized plus watch list loans of 5.0%, non-performing loans (“NPAs”) of 2.2% and a loan loss reserve to NPAs of 80%. UBAB finances its loans through non-interest bearing and interest-bearing deposits generating a low cost of funds of 1.3%. The resulting net interest margin (‘NIM’) is 5.4% and is sustainable as funding costs will decline with declining loan yields. UBAB’s largest shareholder is its management, which holds 4.5% of its common stock. UBAB generates about 20% of its revenue from non-interest bearing or spread activities. Beginning in 2018, UBAB started to generate significant non-interest income from UBCD which resulted in increasing net income margins from 10 to 15% pre-2018 to 30% to 40% post-2018.
UBAB was founded in 1982 in Atmore, Alabama to provide banking services to the Southwest Alabama and Northwest Florida regions. Over the next few years, The Bank of Atmore was merged with People’s Bank of Frisco City to form UBAB. From 2013 to 2023, UBAB’s book value plus dividends increased by 12% per year and EPS grew by 30% per year.
UBAB started repurchasing shares in 2022 when it had excess capital above what it requires to grow its loan book. Recently, UBAB repurchased 5% of its shares from its ESOP. From 2022 to 2023, UBAB repurchased shares at a rate of about 3% per year. In July 2022, UBAB received ECIP funding of $123.5 million for deployment as loans to low-income development activities, including real estate.
A bank productivity measure is the efficiency ratio, non-interest expense divided by total revenues. A good benchmark for efficiency is a 50% efficiency ratio. The average efficiency ratio for commercial banks in Q1 2024 was 59%. UBAB’s efficiency ratio is 50% for the trailing three quarters ending Q3 2024. Given the number of non-interest-bearing services this is a good ratio.
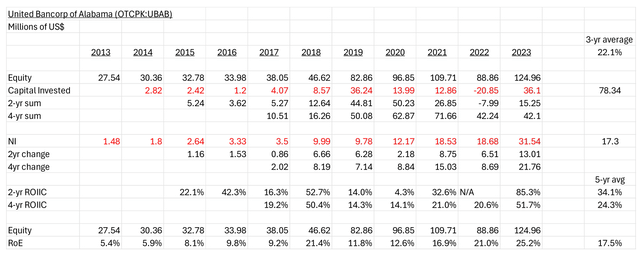
UBAB has generated returns on equity of 18% on average over the past five years. This has been an increase from an average of 11% in the previous five-year period. The average incremental return on equity over the past five years has been 24%, see the calculation below. The ability to generate these returns is the result of increased efficiency, generating US Treasury incentive payments and financing for low-income real estate and business development. Loan growth also increased from 10% per year from 2013 to 2018, to 15% per year from 2019 to 2023. Below is a return on incremental equity capital (“RoIEC”) analysis for UBAB:
UBAB has four levers for earnings growth: 1) successfully bidding and winning US Treasury incentive programs; 2) originating low-income (‘NMTC’) incentivized loans; 3) increased efficiency; and 4) distributing excess cash by buying back shares.
UBAB has economies of scale in the service markets it currently or historically competed in (US Treasury incentive programs). They also have scale based upon the volume of the loans they purchase and originate; so, as they grow, they should become more efficient.
Nationwide US Treasury Incentive Program and Alabama/Florida Loan Market UBAB competes in the US Treasury low-income incentive program on a national basis. UBAB successfully competes with large national banks (such as Wells Fargo and Truist) for New Markets Tax Credit (“NMTC”) and Capital Market Fund (“CMF’) allocations.
Two of the largest US Treasury incentive programs are the NMTC and CMF programs. In 2022, the US Treasury allocated $5 billion of NMTC funds as well as $246 million of CMF funds. These funds are used together with privately raised funds to leverage these amounts for economic development in low-income communities. Other US Treasury programs in which UBAB has participated include: Financial Assistance (“FA”), Equitable Recovery Program (“ERP”) and Bank Enterprise Award (“BEA”) programs. In 2022, these programs have facilitated over $60 billion in borrowings in low-income communities.
UBAB competes in the Southern Alabama and Northwest Florida banking markets. The table below illustrates the population, income and housing price growth over the past five and ten years in the three metropolitan statistical areas (“MSAs”) UBAB competes in:
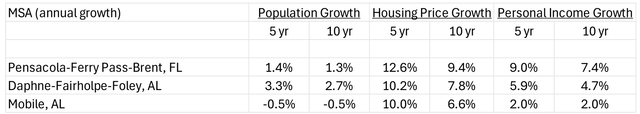
These are healthy growth rates for UBAB to provide loans into.
Downside Protection
UBAB’s risks include both operational leverage and financial leverage. Operational leverage is based upon the fixed vs. variable costs of the operations. There are economies of scale related to some functions such as loan and low-income tax credit/incentives processing and cross-selling of banking services. For banks the amount of non-interest income can provide downside protection especially if this revenue is recurring as is the case for UBAB. Over the past five years, about 30% of UBAB’s revenues were from non-interest income.
UBAB’s balance sheet, as of September 30, 2024 is comprised of $158 million of cash, $294 million of securities and $845 million of loans. The securities have a $26 million mark to market losses which should decline as the securities mature. The largest part of the loan portfolio includes: commercial and industrial loans (27% of loans), commercial real estate loans (20% of loans), construction and land loans (including the US Treasury incentivized loans) (15% of loans) and 1-4 family mortgages (13% of loans).
Financial leverage can be measured by the equity/assets and CET1 ratios. UBAB has higher equity/assets of 7.6% and CET1 of 16.% than other niche lenders (like Northeast Bank, Merchants Bank of Indiana and FFB Bancorp). The historical financial performance for UBAB is illustrated below.
Management and Incentives
UBAB’s management has developed a loan origination pipeline of C&I and real estate loans over time with a specialization in low-income commercial real estate loans. In 2022, UBAB won one of the best banks to work for in Alabama award as well as one of the top 200 community banks in the US award.
Management compensation incentives are not disclosed by UBAB but overall efficiency (including management compensation) is reasonable at 48% during 2023. Other CDFI banks (except Citizens Bank) have much higher efficiency ratios, typically above 65%. Board members have a significant investment in UBAB. The board and management owns 150,092 shares, about 4.2% of shares outstanding ($8.6 million). Stock options provided to management and employees were equal to 0.3% per year of the shares outstanding over the past two years.
Valuation
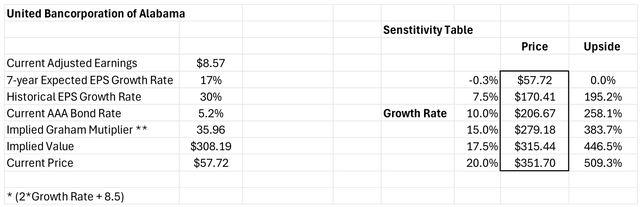
The key to the valuation of UBAB is the expected growth rate. The current valuation implies an earnings/FCF increase of -0.3% in perpetuity using the Graham formula ((8.5 + 2g)). The historical 5- year earnings per share growth has been 17% per year and the 5-year average return on equity of 19%.
A bottom-up analysis based upon UBAB’s market growth rates (US low-income housing and business development loan markets) and historical growth rates results in an estimated 17% projected EPS growth rate driven by expected loan growth rates of 10-15% per year consistent with history. Historically, UBAB’s EPS growth rate was 30% per year driven by new service offerings and new customer relationships over ten years. Using a 17% expected growth rate, the resulting current multiple is 36x of earnings, while UBAB trades at an earnings multiple of about 6.7x. If we use a 3% growth rate, the implied multiple is 15x. If we apply 15x earnings to UBAB’s current earnings of $8.57, then we arrive at a value of $129 per share, which is a reasonable short-term target. If we use a 17%, seven-year growth rate, then we arrive at a value of $308 per share. This results in a five-year IRR of 40%.
Growth Framework
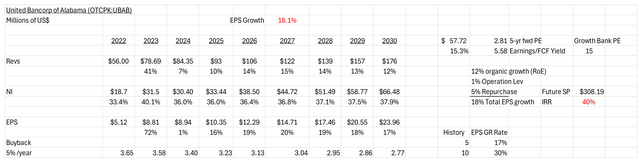
Another way to look at growth and the valuation of companies is to estimate the EPS five years into the future and see how much of today’s price incorporates this growth. We are also assuming about 32% of net income will be used for buy-backs, consistent with the trailing buyback levels. Using the same revenue described above results in a 2029 EPS of $20.55, or 2.8x the current price. If we assume a growth bank multiple of 15x, or $308 per share, similar to the five-year-forward valuation above.
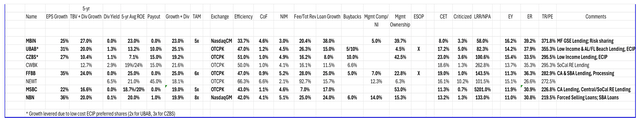
Comparables and Benchmarking
Below are the specialty banks firms located in the United States. Most of UBAB’s competitors are private banks. I have ranked the banks by expected return as calculated as the sum of the earnings yield plus the earnings growth rate. Compared to the specialty banks, UBAB has one of the highest 5-year average return on equity and TBV plus dividends growth, fee income/total revenue and the lowest criticized loan amounts. The high CET allows UBAB to return much of its generated cash flow to investors via share buybacks.
Risks
The primary risks are:
- slower-than-expected market growth due to slower than expected loan growth;
- higher-than-expected efficiency ratios; and
- a lack of new investment opportunities (SBA and low-income housing and business development loans) and/or coupled with higher stock prices making buybacks less accretive.
Potential Upside/Catalyst
The primary catalysts are:
- faster-than-expected SBA and/or low-income housing and business development loan growth; and
- lower than expected efficiency ratios due to economies of scale.
Timeline/Investment Horizon
The short-term target is $129 per share, which is almost 45% above today’s stock price. If the continued service growth due to geographic expansion plays out over the next five years (with a resulting 17% earnings per year growth rate), then a value of $308 could be realized. This is a 40% IRR over the next five years.
|
Disclaimer This letter does not contain all the information that is material to a prospective investor in the Bonhoeffer Fund, L.P. (the “Fund”). Not an Offer: The information set forth in this letter is being made available to generally describe the philosophies of the Fund. The letter does not constitute an offer, solicitation or recommendation to sell or an offer to buy any securities, investment products or investment advisory services. Such an offer may only be made to accredited investors by means of delivery of a confidential private placement memorandum, or other similar materials that contain a description of material terms relating to such investment. The information published and the opinions expressed herein are provided for informational purposes only. No Advice: Nothing contained herein constitutes financial, legal, tax, or other advice. The Fund makes no representation that the information and opinions expressed herein are accurate, complete or current. The information contained herein is current as of the date hereof but may become outdated or change. Risks: An investment in the Fund is speculative due to a variety of risks and considerations as detailed in the Confidential Private Placement Memorandum of the Fund, and this letter is qualified in its entirety by the more complete information contained therein and in the related subscription materials. No Recommendation: The mention of or reference to specific companies, strategies or instruments in this letter should not be interpreted as a recommendation or opinion that you should make any purchase or sale or participate in any transaction. |
Editor’s Note: The summary bullets for this article were chosen by Seeking Alpha editors.
Editor’s Note: This article discusses one or more securities that do not trade on a major U.S. exchange. Please be aware of the risks associated with these stocks.
RELATED POSTS
View all

SEDG Stock Jumps on Strong Q4—Is SolarEdge Finally Bottoming Out?
February 24, 2025 | by ltcinsuranceshopper

Billionaires Are Selling These Dow Jones Stocks and Buying These Instead
February 23, 2025 | by ltcinsuranceshopper

Free Hypnosis Script: Turn Anyone into a Hypnotist | Beginner-Friendly
March 9, 2025 | by ltcinsuranceshopper
