
Analysis-Ominous market signals show more trouble could await US stocks
March 12, 2025 | by ltcinsuranceshopper
By Lewis Krauskopf and Suzanne McGee
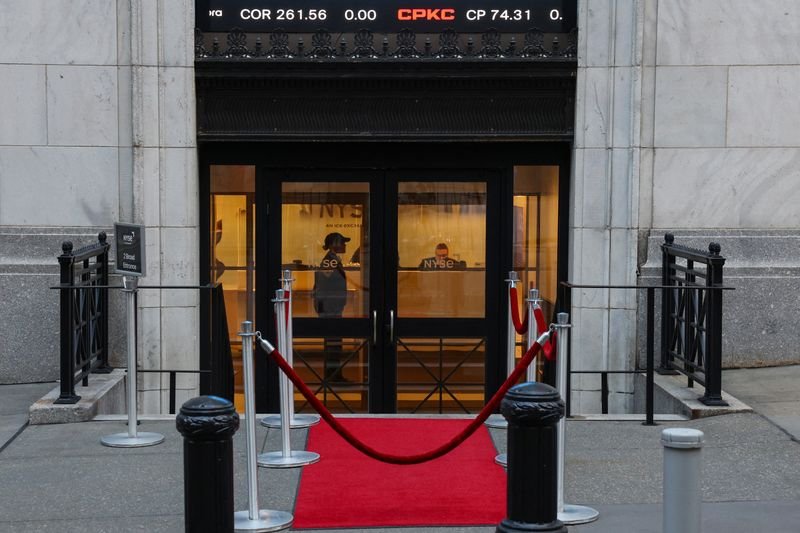
NEW YORK (Reuters) – Investors are wary about worrisome market signs, after a steep U.S. stocks selloff that has wiped out more than $4 trillion in value and all of the gains notched following President Donald Trump’s election.
Among the signs are technical signals such as the S&P 500 on Monday closing below a crucial trend line, a key measure of the market’s internals weakening, a concerning pattern in volatility futures contracts, rising cash levels among investors and de-leveraging by hedge funds away from equities.
U.S. equities experienced a punishing drop this week, with the S&P 500 briefly falling into correction territory on Tuesday as uncertainty over Trump’s tariffs exacerbated worries about economic growth.
“This is a classic S&P 500 selloff, with growth stocks taking it in the teeth,” said Patrick Fruzzetti, managing director of Rose Advisors, part of wealth management firm Hightower Advisors. “With more bearish signals appearing, this could be ongoing for quite a while.”
After registering its biggest drop of the year on Monday, the benchmark S&P 500 index endured another volatile day on Tuesday, ending down 0.8%. The index has dropped 9.3% from its February 19 record high, with some of the market’s highest fliers including Nvidia and Tesla hit particularly hard. It is now down 3.6% since Trump’s November election.
TARIFF, RECESSION UNCERTAINTY
The ominous market signals add to growing anxiety about the economic outlook. A Reuters poll last week found 95% of economists across Canada, the U.S. and Mexico said the risk of a recession in their respective countries had increased following Trump’s chaotic tariff implementation.
Trump has offered conflicting views on whether the U.S. could face a recession amid tariff concerns. Over the weekend he declined to predict if there could be a recession. On Tuesday Trump’s take on a possible recession was: “I don’t see it at all.”
“The back and forth on tariff announcements is playing havoc with consumer and business confidence,” equity strategists at HSBC said in a note.
Shares of major U.S. airlines sank on Tuesday after Delta Air Lines slashed its first-quarter profit estimates by half. Delta’s CEO said the environment had weakened due to U.S. economic uncertainty.
WORRYING TECHNICAL SIGNALS
On Monday, the S&P 500 closed below its 200-day moving average — a closely watched long-term trendline — for the first time since late 2023.
Bespoke Investment Group found that in 15 other instances when the S&P 500 stayed above its 200-day moving average for at least a year, when the index finally fell below the trendline, returns over the next year were generally weaker than normal. The S&P 500 rose 6.9% on a median basis in those cases compared with a 10.3% one-year median gain historically.
RELATED POSTS
View all

Macron says only Ukrainian President Zelenskiy can negotiate peace for his country
February 14, 2025 | by ltcinsuranceshopper
US Ambassador to Israel: Leave Chevron and Netflix alone
June 7, 2025 | by ltcinsuranceshopper

Hedge fund Elliott shakes BP from its strategic slump
February 14, 2025 | by ltcinsuranceshopper
