


Donville Kent Asset Management February 2025 Commentary
 March 13, 2025

Images By Tang Ming Tung
The second half of February and the start of March have seen a pronounced selloff in stocks, especially in momentum stocks. The pace and magnitude of media coverage, casual conversations, and daily reports surrounding tariffs has reached a fever pitch. The tariffs are the most widely discussed political and market topic since Covid. This has led to a sell first and ask questions later mentality, which we’ll speak to in more detail below.
A stock market correction, especially in momentum, was somewhat expected after such a strong run in 2024. The pieces are still in place for a good 2025. Many small companies in Canada go through a period without any news from November until March or even April (based on delayed reporting of Q4 earnings). As the average holding period for investors these days continues to decline, this lull in news can lead to stagnant or correcting stock prices. This sell-off has been across the board, with more than 1/3 of all TSX stocks down more than 20% from their highs.1
The Capital Ideas Fund declined 6.23% in February and is now down 5.25% in 2025.2 That being said, the actual companies continue to perform, they continue to sell, grow, and generate cash. We’re excited for our companies to report in March and April.
As discussed in our last newsletter, we see interest rates lower by year-end, inflation surprising to the downside, and company earnings accelerating versus the last couple of years. If the economy slows, which it has been, there are still plenty of pockets of growth where there are secular tailwinds. These segments will grow independently of overall economic growth. Factor in declining rates, small-mid-cap growth stocks – which are much cheaper than large caps – should do well over the next year.
The market praised Trump’s economic policies around cutting taxes and regulation but that was short-lived as his focus shifted to tariffs. Goldman Sachs economists estimate up to a 3% hit to S&P Earnings. Goldman estimates that every 5-percentage point increase in the tariff rate would lower the S&P 500’s earnings per share by roughly 1% to 2%, if the tariffs are in place for the full year. This analysis is interesting because obviously the tariffs impact certain businesses more than others, but the overall impact on earnings is not even close to what the market response has been. Multiple banks now estimate a ~2% impact to Canadian GDP and ~0.5% impact to US GDP, plus a 1% bump to overall inflation.
This market sell-off has been broad-based, even though some companies will be impacted significantly while others are immune or shielded from the impact. We view this as the opportunity at the moment. Being able to do the work and sift through the landscape leads to some great buying opportunities. The main point we’ll make today is how quickly market sentiment has shifted and staying rational and making counter-emotional investments, especially at max market pessimism, has been the winning strategy.
Sentiment
The sell-off the last few weeks has been notable because bearish sentiment (negativity toward the market) reached one of its highest readings ever. From our point of view, this is mainly driven by news headlines around tariffs, inflation, etc. Investors dislike uncertainty. Uncertainty leads to customers sitting on their hands, companies delaying investments, and investors waiting for “certainty”? Maybe, just less uncertainty? However, uncertainty is the name of the game.
Many individual stocks have declined 20-30% from their highs, with market indexes down ~10%. Historically speaking, markets correct at least 10% in most years. From a behavioural perspective, however, each time this does occur, many investors panic and jump to conclusions like this is the start of the next 2008/2009 financial crisis, or 2022 inflation scare. During the last week, we have been asked many times how we “handle” market corrections. 1. We don’t think anyone can time the market and know when to get out and then jump back in. 2. We own quality businesses with quality balance sheets that don’t trade on expensive multiples. These companies continually grow revenue, grow earnings, and increase the intrinsic value of their business. Their stocks may fluctuate with the ebbs and flows of the overall market, but we know they are increasing the underlying value of their business, which will be reflected in their share price over time.
Taking a closer look at the specific sentiment readings, there hasn’t been bearish sentiment this high since 2022, 2008, 2000 and 1990; and we haven’t seen Bullish readings this low since March 1989.
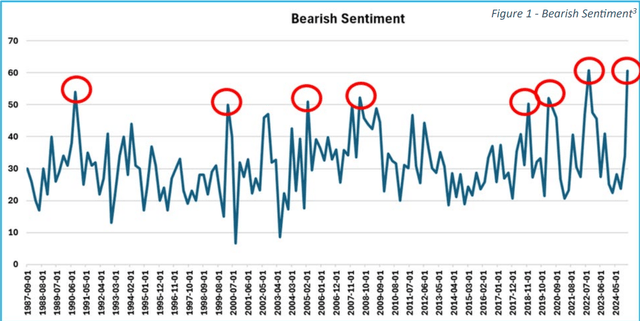
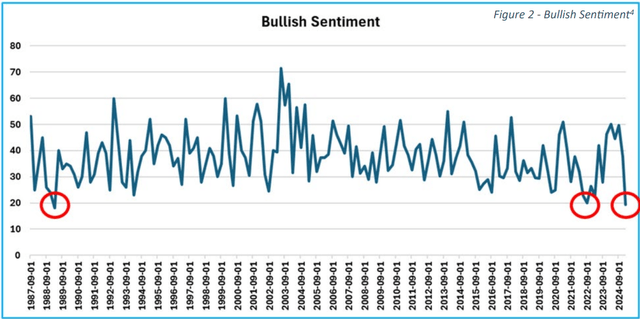
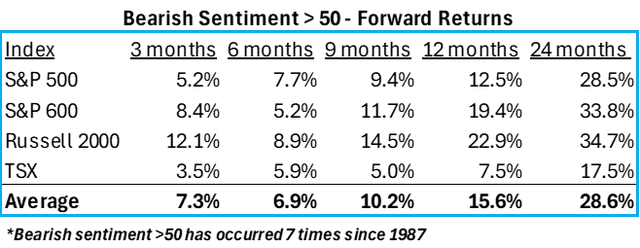
The important question to ask is how does the stock market perform once it hits these extreme levels? The tables below show how specific indexes performed in the 3, 6, 9, 12, and 24 months after hitting bearish sentiment >50 or when bullish sentiment is < 20. September 2022 is the only other time in the last 40 years when bearish sentiment got above 50 (currently 61) and Bullish sentiment got below 20 (currently 19). When these readings peaked in September 2022 the market quickly bottomed, and momentum returned. As you can see, forward returns from these levels are strong, especially 12- and 24-months out. The bearish reading in 2008 is the only occurrence where forward returns weren’t positive.
Valuations
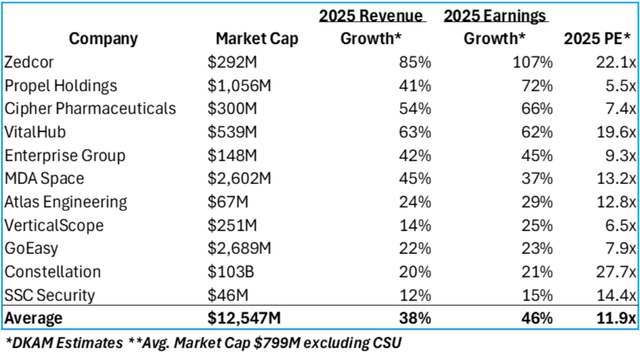
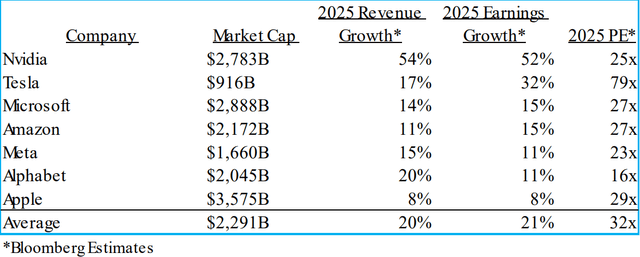
We have updated the valuations we referenced in our last newsletter in order to reflect this recent sell-off. It is important for our investors to know the metrics around what we own. In broad strokes, our investors own a portfolio of companies growing revenue ~38%, growing earnings ~46%, and trading on ~11.9x cash earnings.5 This compares to the most owned group of stocks growing revenue and earnings at half the pace with significantly higher valuations. As we have seen, the stock prices of these smaller growth companies can be volatile, but we believe the long-term return for these companies will be worth it. We will roll forward these projections into 2026 estimates in our next newsletter, which will show how fast-growing companies quickly become even cheaper.
Based on some of the questions and comments we’ve received recently, it makes sense to take a second and go over how we value a business versus what can be found online.
If you pull up a website, like Yahoo Finance, it quotes Constellation Software’s PE Ratio as 124x. Considering its growth and profitably, this would obviously be an expensive stock and not something we would own. But let’s work backward. Using 124x TTM PE, from online sources, would suggest that Constellation made $831m in profits ($103B market cap/124x PE = $831m). In Constellation’s most recent financials (below), you can see they generated $517m in operating income in the quarter and $1,518m in the first 9 months of 2024 and $1,268m in 2023. They have very minimal debt and used the cash generated to acquire more businesses. Point being, they generate significantly more cash earnings than what stringent formulas from websites suggest.
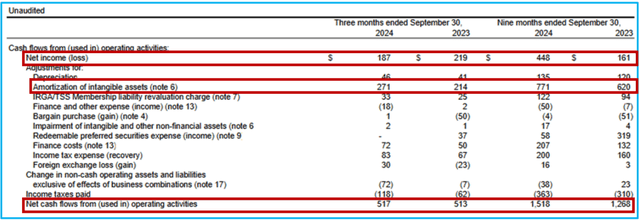
Our analysis shows that CSU generates 21% cash margins, meaning every dollar of revenue generates $0.21 of cash earnings that they can redeploy back into the business. Again, using rough numbers, based on estimated 2025 revenue of ~$12,200m, at 21% cash margins, equates to $2,562m in cash earnings, which is reported in $USD. This puts CSU on 28x 2025 earnings, much cheaper than the 124x TTM PE that people go online, look at, and take at face value.
There are many stringent accounting rules that make companies report financials in certain ways, even if it makes it harder for the average investor to understand the outcome. Even Warren Buffett has criticized GAAP (Generally Accepted Accounting Principles) because he believes it misleads investors. He has called GAAP accounting a “shame of capitalism.”
Here’s a not so quick example to drive home the point. When companies like Constellation, Berkshire Hathaway, or VitalHub, acquire a business, accounting rules make them value the acquired company’s balance sheet assets and what they pay in excess of that is considered an intangible asset or goodwill asset. Two issues: one is that due to accounting standards, a lot of companies don’t have their most valuable assets like intellectual property, patents, trademarks, and certain technology carried on their balance sheet (due to accounting rules around internally generated assets). So, valuing a company using book value or using their stated equity to calculate ROE (return on equity) is misleading to say the least.
For illustrative purposes, pull up Nike’s most recent balance sheet. Under assets, they have cash, inventory, property/plant/equipment, accounts receivable making up a majority of the $38B in assets and total equity of $14B, but the business is valued at $118B. Nowhere on that balance sheet will you find the full value of the Nike trademark, the Jumpman logo trademark or any other of their 100s of trademarks, which are estimated to be worth tens of billions of dollars. Using their stated equity value of $14B is pretty meaningless.
The second issue: if you acquire a business, the accounting rules make you put these intangible assets on the balance sheet and amortize it as an expense. This is called a “non-cash expense” and makes the business look less profitable than it really is.
Let’s use Constellation’s accounting practices as an example. Their financial note below shows that they acquired a business with $1,974M in assets and qualified $1,417M of those assets as intangible assets.
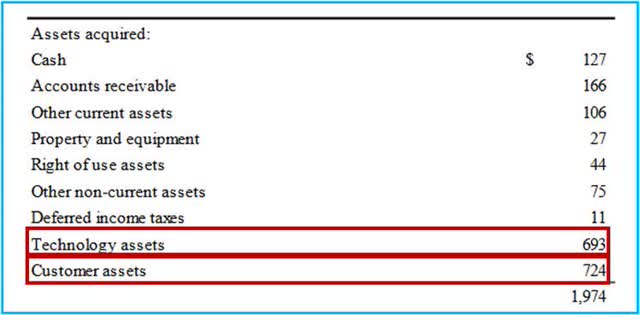
Accounting rules make Constellation put that $1,417m on the balance sheet and then amortize it over 5 years (this can vary). Meaning their income statement will show a $283m yearly expense, lowering reported net income even though it is a made-up non-cash expense. After 5 years, this asset is completely gone from the balance sheet. In reality, the value of these intangible assets will not likely decline in value and, in many cases, actually increase in value as a business grows.
Good acquirers improve the value of the asset over time, but accounting rules make the financials appear like the opposite. This is why “book value” for companies outside of financials and some industrials is fairly meaningless these days (equity value is reduced when it actuality it should increase) and why we have to make adjustments in our models to get any type of accurate ROE calculation.
This isn’t necessarily a strategy for shareholders because it lowers the company’s tax expense and saves the company money. It, however, lowers the reported Net Income so it makes them appear less profitable than they really are. Again, we urge investors to focus on after-tax cash earnings. What the company really generates and is able to reinvest.
The point being, as investors, we look at how much cash a company is generating and at what rate they can reinvest it back into their business. So, if we quote a stock to be trading on 10x and somewhere online is saying it is 100x, you can most likely assume there are accounting issues at play.
Stock Specific Comments
We were fortunate in February as the RediShred (KUT:CA)(RDCPF) acquisition closed and we received a significant amount of cash which allowed us to deploy that capital back into our highest conviction stocks at a time when their share prices were pulling back. We received our $5.00/share payout which translated to a ~15% annualized return since our initial investment in 2016.
Converge Technology (CTS) received a takeout offer on February 7th and we sold our position over the few days that followed. We increased our position size by over 30% from January 14-23rd, which makes calculating the IRR misleadingly high.
We believe this is great timing as we are now deploying that cash back into our highest conviction investments at a time when they have gone on sale. A lot of stocks have pulled back 20-30% from their highs. This should set up for a strong second half of 2025 and into 2026.
Enterprise Group (E)(E:CA)
A common comment of ours has been that long-term compounders don’t get the respect they deserve because it is very hard for investors to understand the impacts of compound growth. In the case of Enterprise, they are a different company since launching their EPP division just a couple of years ago. There are some legacy viewpoints on the business where people don’t see the transformation that has occurred.
This recent stock decline started when Canaccord initiated research on Enterprise. In our opinion, their projections will be embarrassingly wrong. The stock declined on the report because they projected significantly less growth and profitability than what we believe will occur. Our projections are more in- line with Raymond James which is projecting 50% higher EBITDA than what Canaccord has! They don’t mention the IRR or ROIC for Enterprise at all. Nowhere in the report. This is the #1 reason why we have such high conviction in the stock.
The stock deserves a higher multiple because it has more than double the ROIC, quadruple the organic growth versus its comparables, and a net cash balance sheet versus the average extremely levered balance sheets of the competitors.
We’re not focusing on “the next quarter” because we’re confident on where the business will be in a couple of years. Their reported Ǫ4 coming later this month won’t show the top line and profitability growth that is now baked in for 2025. We’ve been using any weakness as an opportune time to add to our position because their 2025 and 2026 results will be markedly higher. We expect that from the end of 2024 to the end of 2026, Enterprise will triple its earnings per share and is now trading on <6x 2026 cash earnings.6
The macro in the Nat Gas market continues to get more buy-in from some of the largest players. From a tariff perspective, Canada still produces the cheapest Natural Gas by a wide margin, meaning the imposed tariffs shouldn’t hinder demand plus our ability to export to Asia for the first time ever comes online in a few months.
Shell (SHELL) expects a 60% Rise in Global LNG Demand by 2040 – Global demand for LNG is estimated to rise by around 60% by 2040, driven largely by economic growth in Asia, AI impact and efforts to cut emissions in heavy industries and transportation, Shell said in an annual report on Tuesday Demand for natural gas continues to rise globally as the world transitions to cleaner fuels. Industry forecasts LNG demand to reach between 630 M and 718 M metric tons a year by 2040, Shell said in its 2025 annual LNG outlook.7
Zedcor (ZDC)(OTCPK:ZDCAF)(ZDC:CA)
Zedcor is an example of a stock where the stock price seems to be dictating the narrative instead of the improving fundamentals. They should report a strong quarter but more importantly we foresee the business being orders of magnitude larger than it is today and we’ve been using the weakness in the stock market as a buying opportunity.
Considering where the company is now, we think the company will uplist the stock to the TSX this year. This should bring in some institutional investors that couldn’t invest while on the venture as well as being a more stable investor base.
MDA Space (MDA)(OTCPK:MDALF)(MDA:CA)
MDA Space reported Q4 results on Friday, March 7th, and the stock increased 18% that day. The results provided a great example of the available opportunities in this market. Their growth and backlog are being driven by the massive demand for low earth orbit satellites. The addressable market has expanded significantly because the launch costs have declined significantly in recent years. MDA has a $5 billion backlog of business and a $15 billion pipeline.
MDA Q4 Earnings Results
Revenue $347m +69% EBITDA $71m +69%
- EBITDA Margin 20.5% Cash Earnings $40m +58% Net Cash balance sheet 2025 Guidance suggests 45% revenue growth and 40% EBITDA growth Stock is trading on less than 10x 2026 cash earnings.8 Tariff related “We have done detailed work and are deeply engaged with governments and agencies on both sides of the border. We believe our potential tariff exposure is manageable. Approximately 90% of our backlog is outside the US, and only about 25% of our suppliers are based in the US. We are confident in our ability to manage the situation without significant impact on our business.”
Inflation
There is a lot of attention around inflation and specifically tariffs (more detail in last newsletter). The point we want to make today is that there has to be a reason that rates have declined for the past 40 years. Has that reason changed?
We’ve written about demographics & technology many times, so we think that point is fairly established. Today we’ll point to the financial impact of how an aging demographic is deflationary.
The private sector debt is roughly $49 trillion and is falling faster than public sector debt is climbing (as a percentage of GDP) at $33 trillion. The private market is saving more than the public market is spending. This is the major deflationary force and what has been in place for the last 40 years. There was a Covid bump, but this long-term trend is still firmly in place. Many focus on government spending but forget to factor in the declining private sector spending, which one needs to do to come to a fulsome outlook on inflation going forward.
Final Thoughts
Sentiment goes through cycles. Markets go through cycles. Uncertainty is the norm. Embrace uncertainty.
Historically, buying max pessimism is a winning strategy. Factor in the fact that there are thousands of stocks that someone can invest in, being able to pick a small portfolio of great companies that will grow earnings independently of the economy becomes a real advantage. Let’s not get distracted by the political circus.
Taking this political and growth scare at face value and understanding that the economy is not the stock market, we continue to invest in stocks that will grow in any environment. Similar to when all growth stocks declined in 2022, we have focused even more on our highest conviction investments. We have avoided investments in tariff related companies like steel, aluminum, lumber, autos, and consumer goods. For many of our companies, growth in 2025 and 2026 is baked in, balance sheets are strong, and these stocks will be the ones that perform well when sentiment bounces back.
Jason and I recently were guests on the We Study Billionaires Podcast. The video can be found on YouTube – Finding High-Growth & Long-Term Winners w/ Jason Donville & Jesse Gamble. Click here to watch
Finally, Jason and I will be hosting an investor webinar on Wednesday, March 26th. Many of our investments will have reported Q4 earnings by then, plus we’ll discuss all the new political dynamics. Invitations will be sent out to our mailing list, plus details posted on our website. A replay will be available for those that cannot attend.
Sincerely,
J.P. Donville & Jesse Gamble
|
Footnotes 1 As of March 7, 2025. 2 Class A Lead Series, net of fees and expenses. 3 From AAII Investor Sentiment Survey 4 From AAII Investor Sentiment Survey 5 Cash earnings a DKAM estimate, taking earnings and adding back certain non-cash items such as amortization of intangible assets. 6 DKAM estimates 7 Shell 2024 Q4 Earnings Report 8 DKAM estimate |
Editor’s Note: The summary bullets for this article were chosen by Seeking Alpha editors.
Editor’s Note: This article discusses one or more securities that do not trade on a major U.S. exchange. Please be aware of the risks associated with these stocks.
